Save up to 20h per Ha per season in vineyards monitoring
Eliminate a minimum of 2 sprays per season
Act where and when needed
Turn your microclimates into a business advantage.
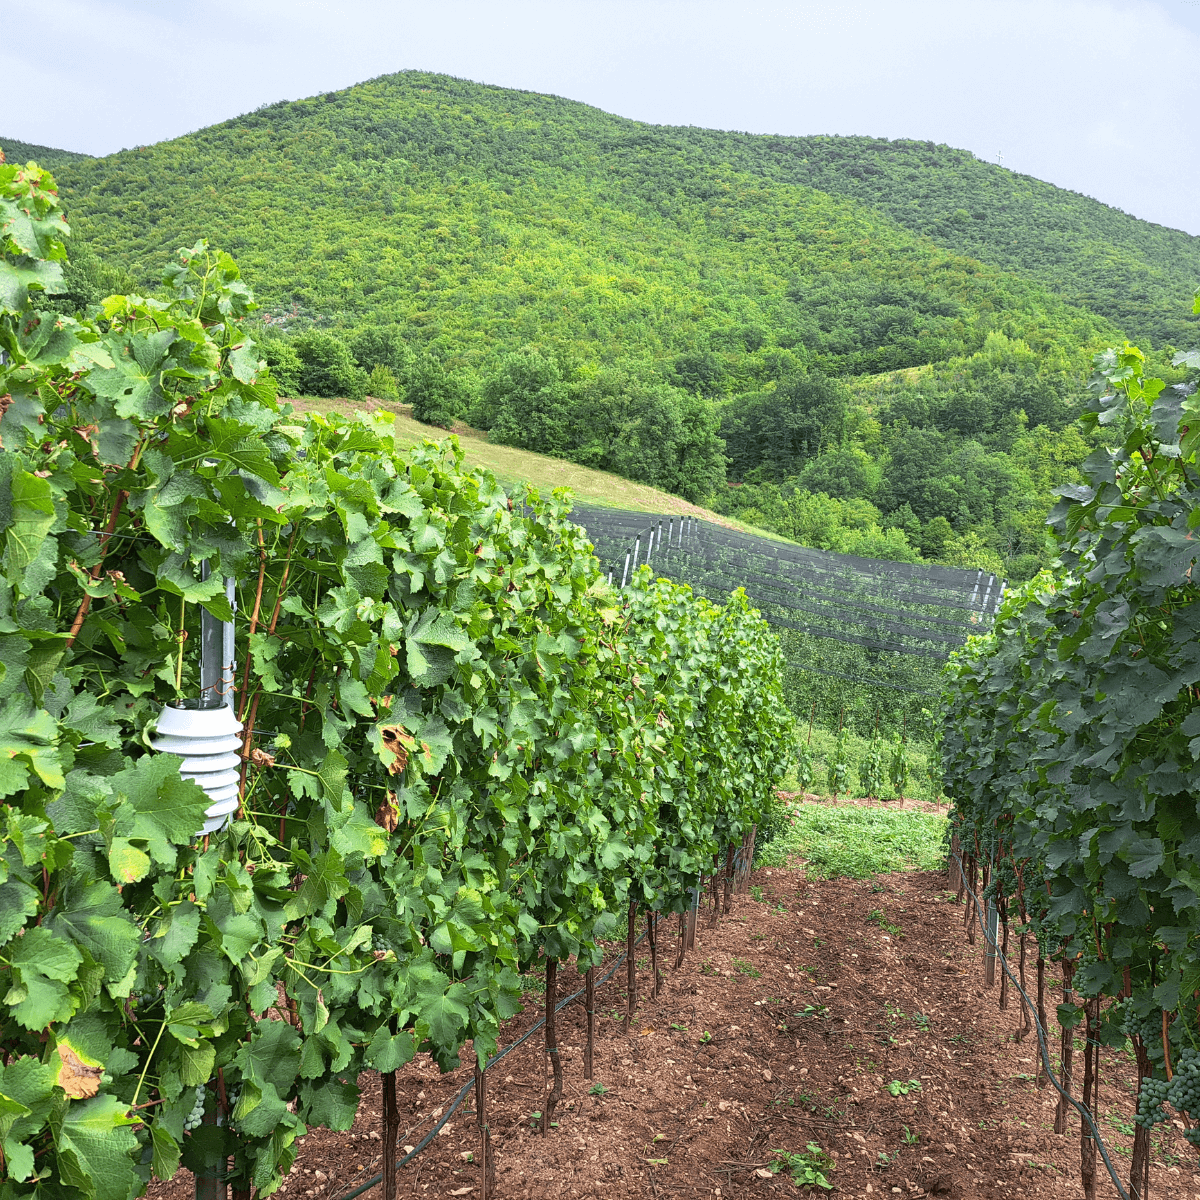
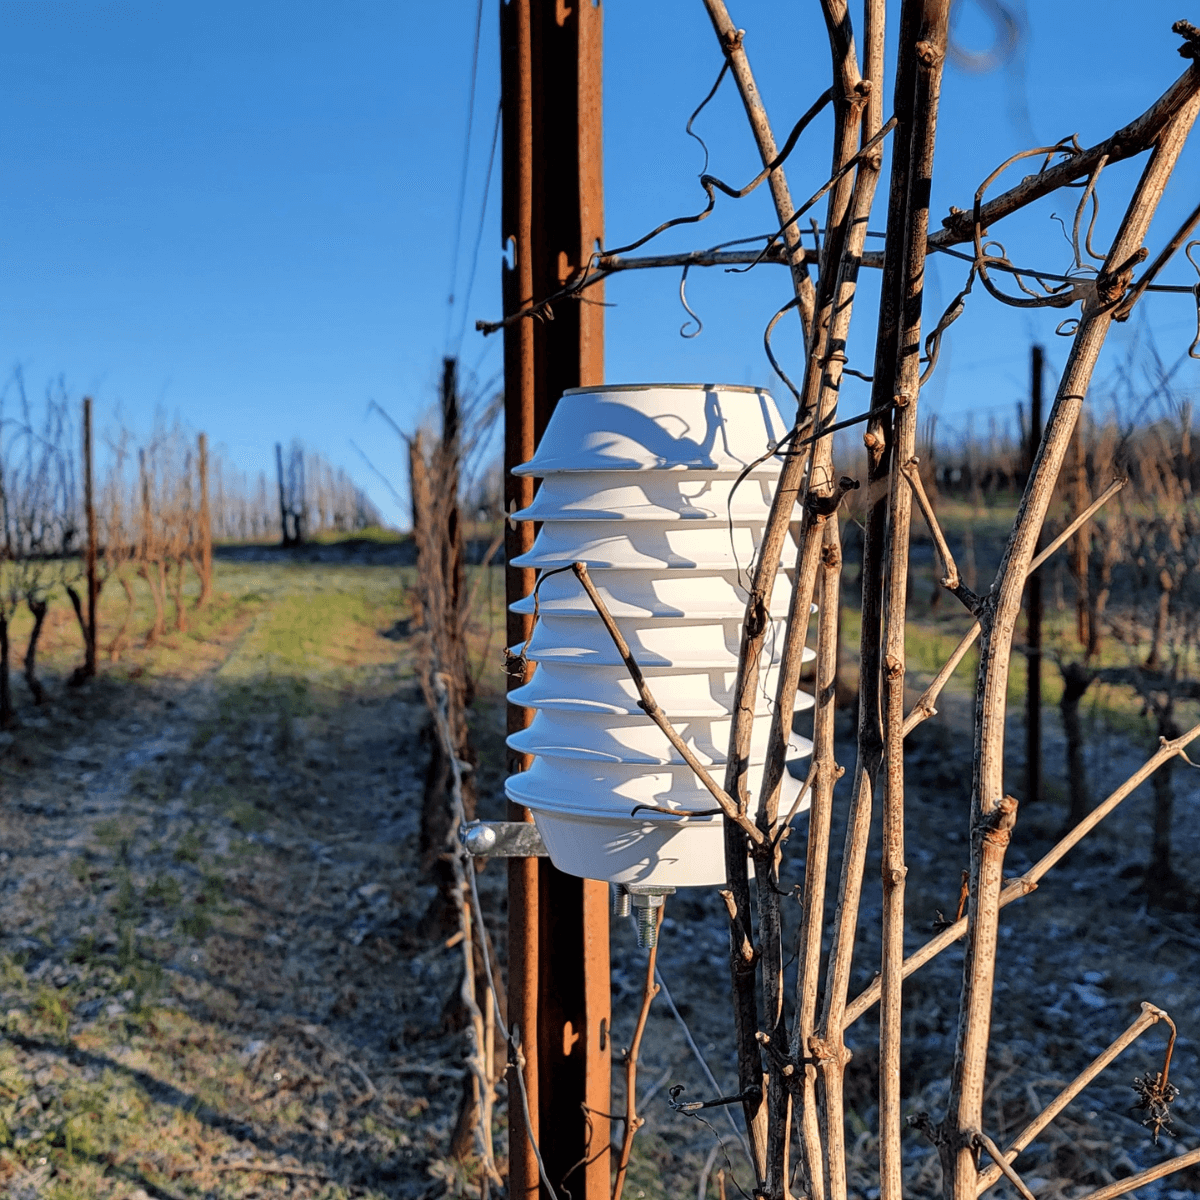
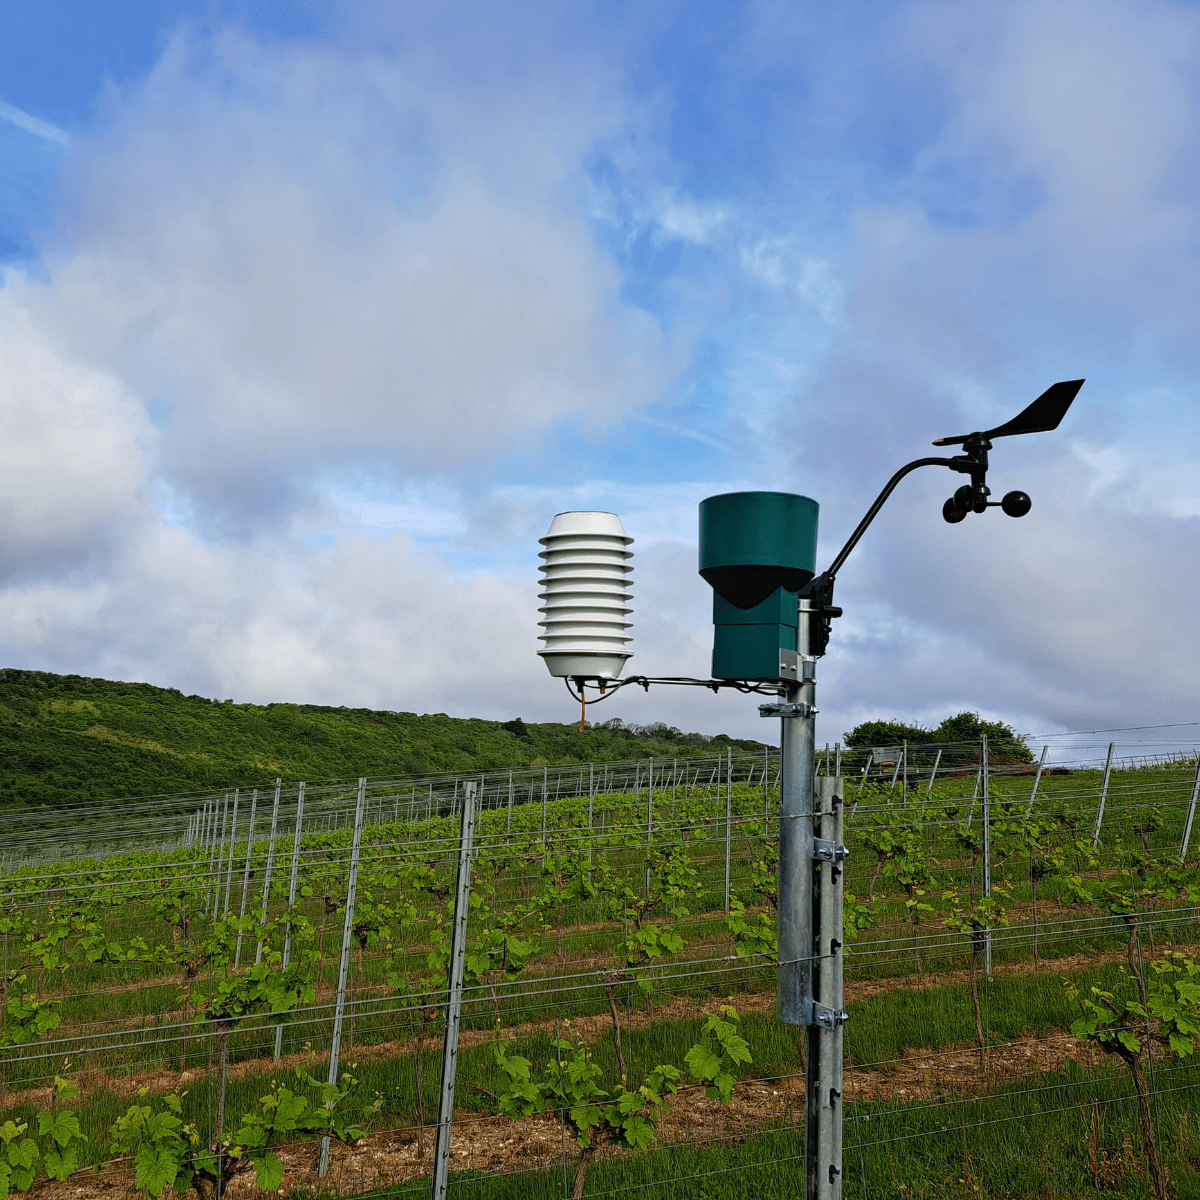
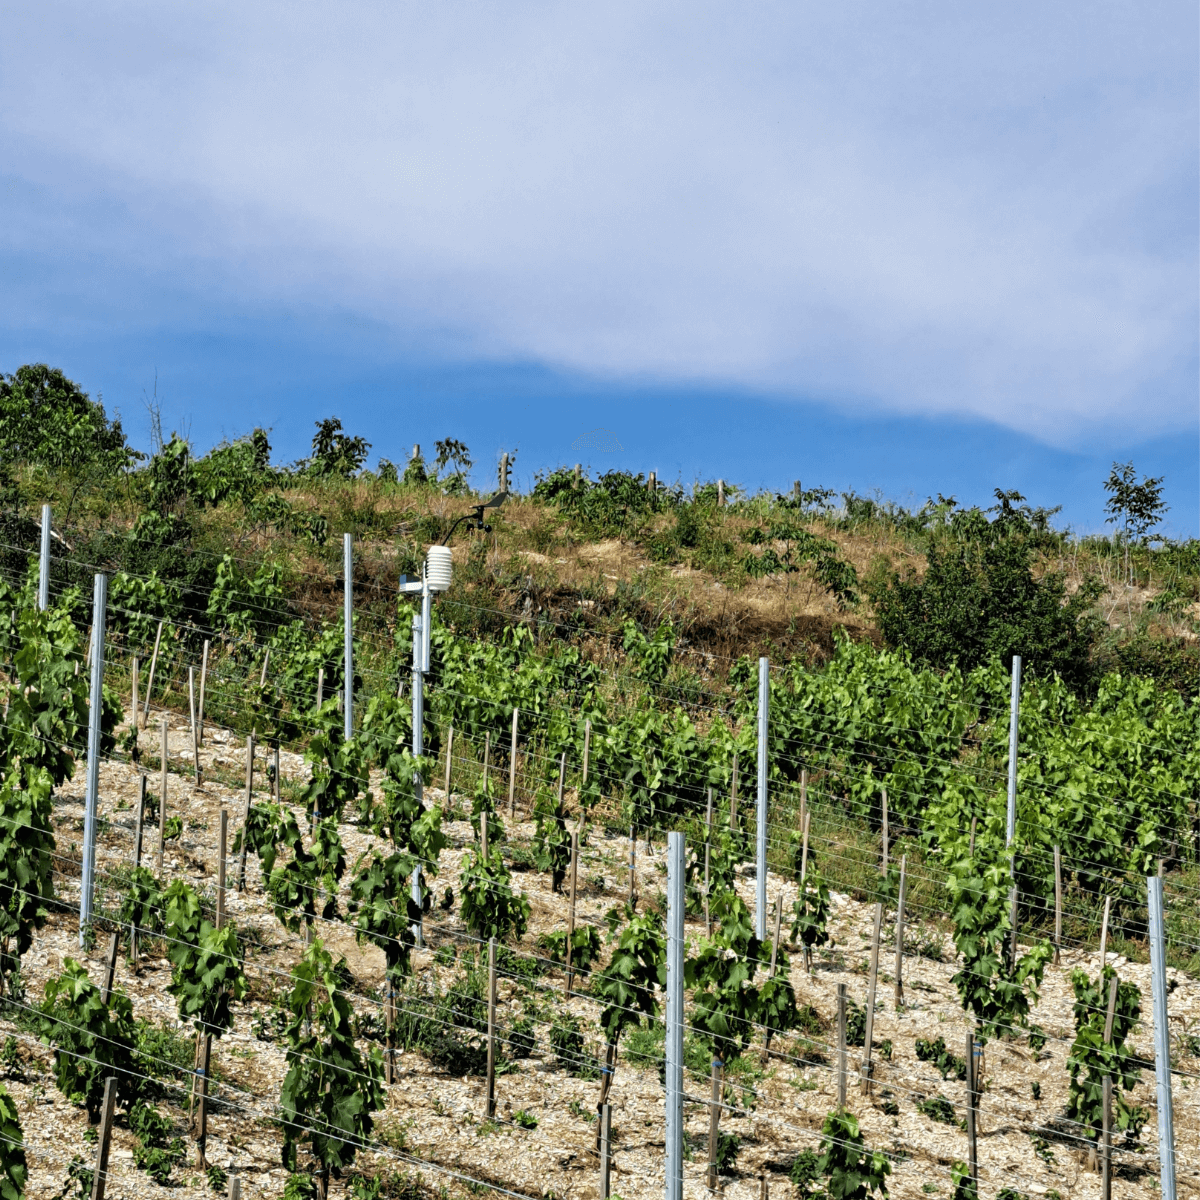
SENSING FROM WHERE
ACTION HAPPENS
WINESSENSE APP
History and forecast view
Easily access the recent history of developments in your vineyards using the graphs. Understand the future implications trough a convenient forecast render.
Heat map view
Interactively visualize the current status and the recent history of your vineyards on the map. Choose the parameter to render and track the variability.
Notifications view
Get timely notifications and early warnings about the trends in you vineyards. Weather, diseases and plant growth will not surprise you. Observe the events throughout the season in chronological order.